
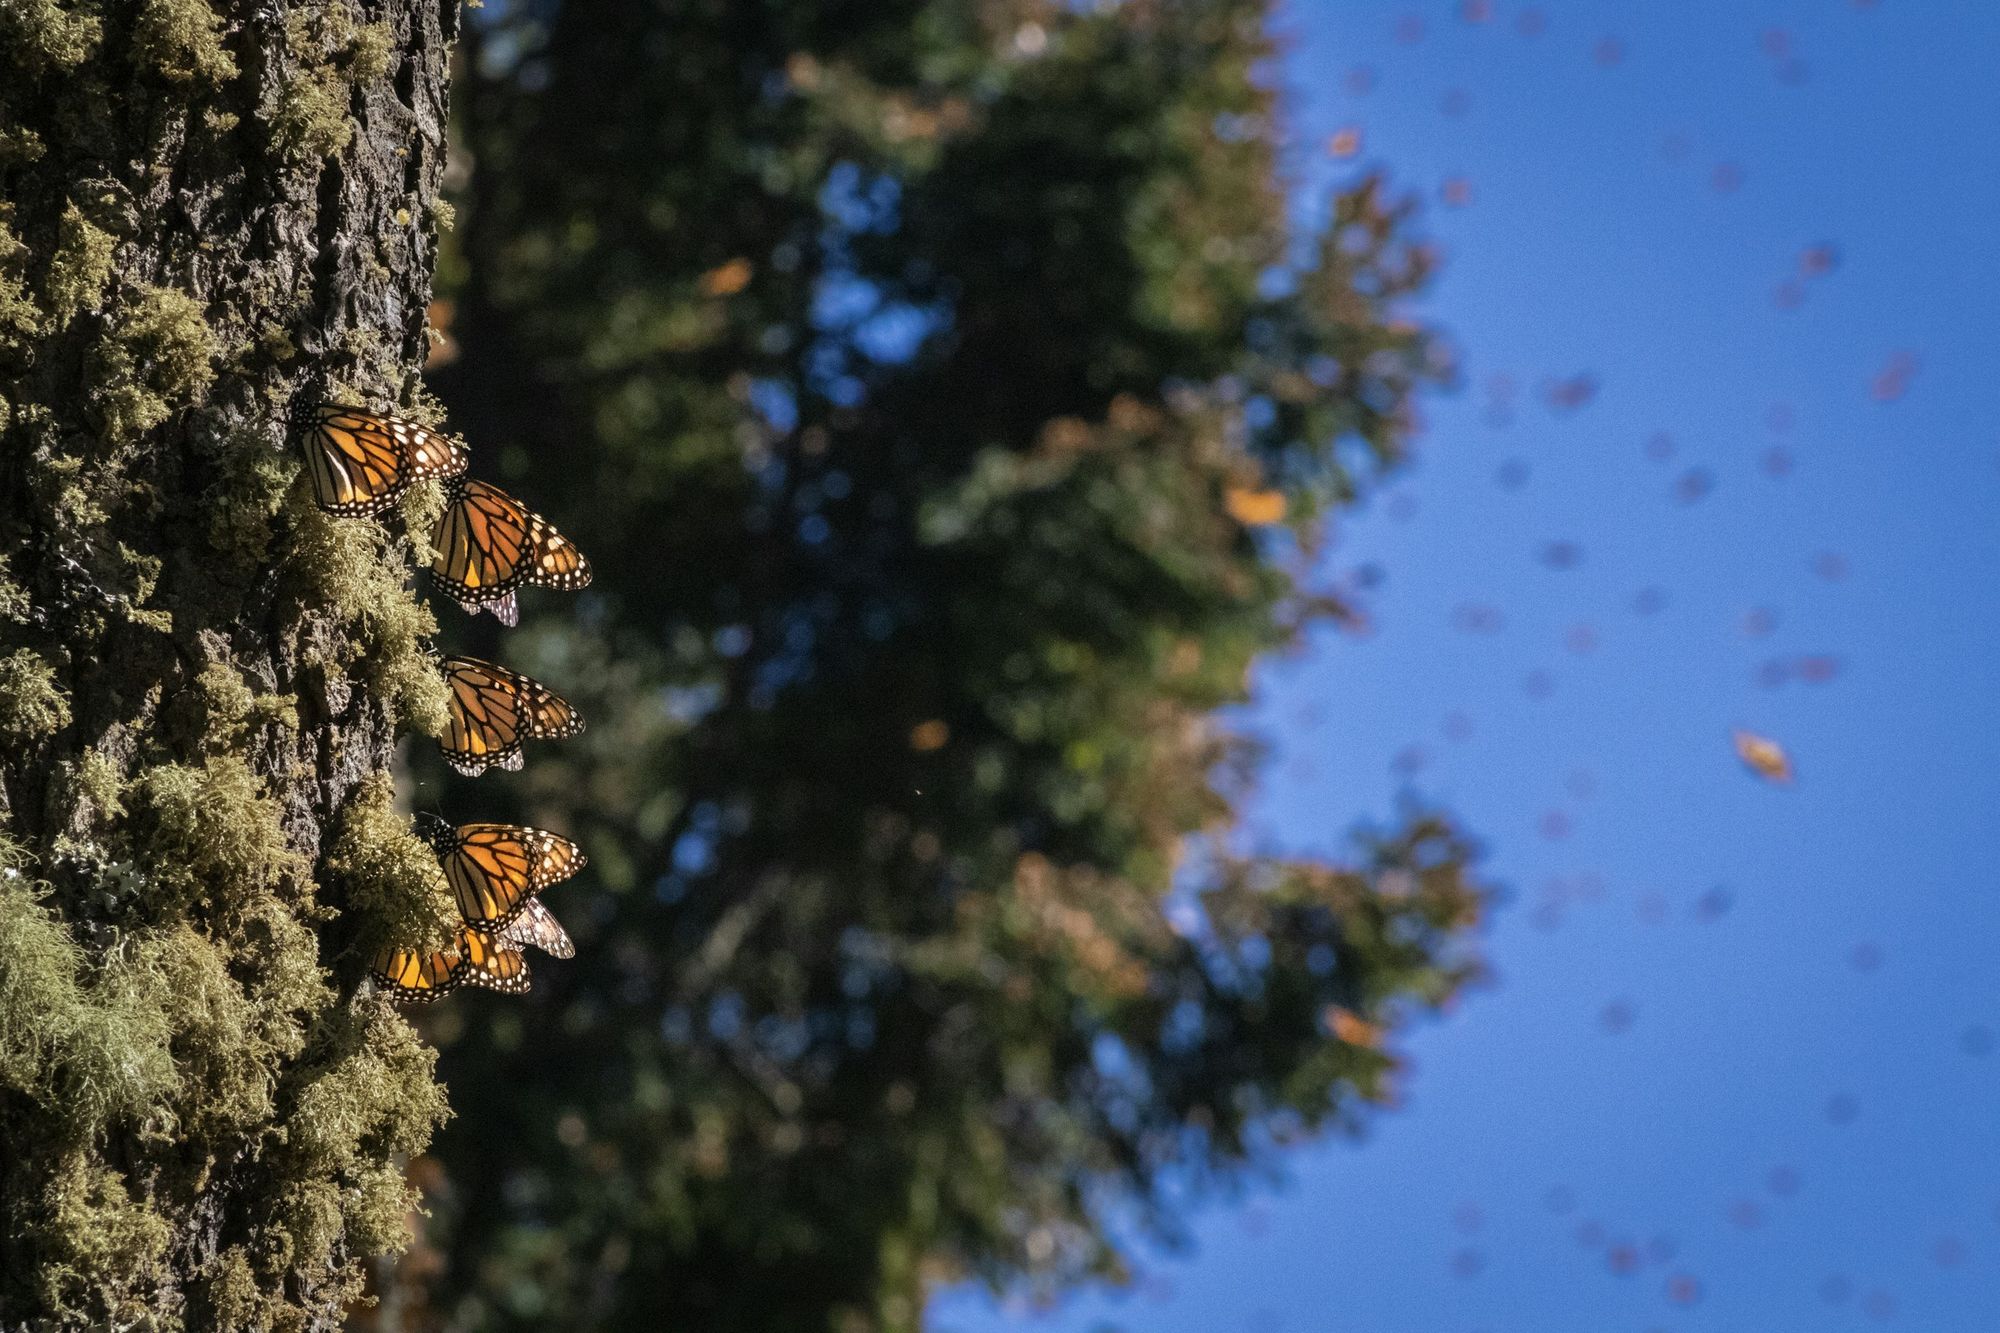
Monarch Migration explorer
The Monarch Migration
Every dot on this map stands for real monarch sightings reported by people across Canada, the United States and Mexico from 2016 to 2026. Pick a month and watch the monarchs move: north in spring, south in fall, and into the mountains of Mexico for the winter.
Danaus plexippus on the move
How to read it
Three ways in
01
Pick a month
Use the month buttons, or press Play, to light up the sightings from one month across all ten years. Spring sightings climb north; fall sightings funnel south.
02
Change the view
Switch from the map to By month, By year, By country or Life stage. The same dots rearrange, so you can count them a new way.
03
Find a place
Type a province or state into the search box. Hover or tap any dot to see the real sighting it is placed at.
Read it right
Every chart has limits. Here is what this one can tell you, and what it cannot.
What this shows
- Ten years of reportsWhere and when people reported seeing monarchs, 2016 to 2026 (386,118 sightings).
- The seasonsSpring and summer spread north. Fall funnels south to Mexico and the California coast.
- The busiest months and countriesSwitch views to count the same dots a new way.
- The past four weeksA live layer of new sightings, updated weekly.
What it does not show
- How many monarchs there areSightings are reports, and more people report from cities and busy parks.
- Exact locationsEach dot is placed inside the province or state of a real sighting.
- A rising populationThe rise over the years mostly shows more people using phone apps, not more monarchs.
Data: GBIF.org occurrence records for Danaus plexippus (CC0, CC BY and CC BY-NC; most from iNaturalist), downloaded 11 October 2026, plus a weekly live pull. Boundaries: Natural Earth. One dot stands for 75 sightings from the same month. See Data and credits for details. Not affiliated with or endorsed by GBIF or iNaturalist. The narrated tour is read by an AI voice (OpenAI gpt-audio, via OpenRouter).
Keep exploring
More data stories
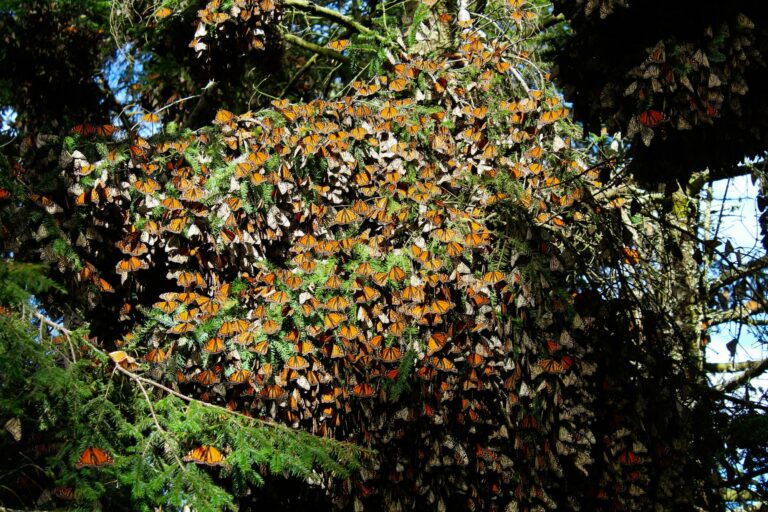
 Story 01 · PopulationTwo populations, thirty wintersThe eastern monarchs that winter in Mexico and the western monarchs on the California coast, counted every winter since the 1990s.
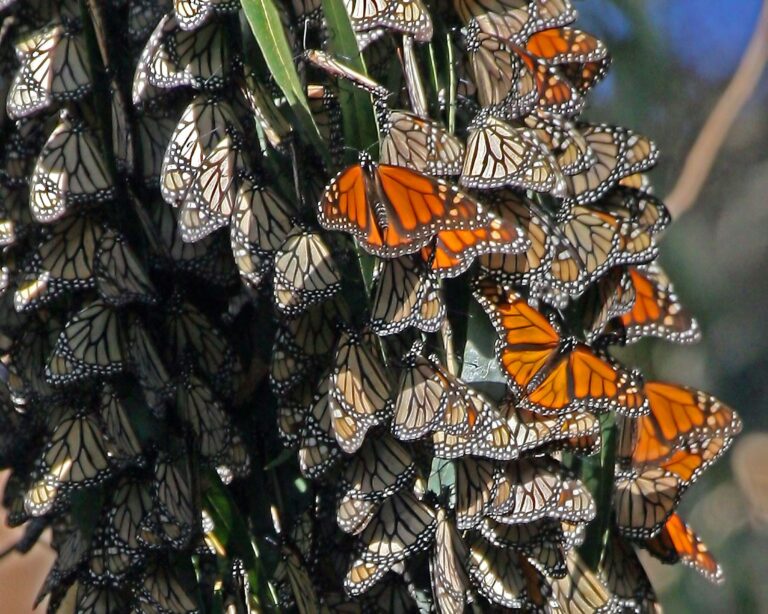
 Story 02 · For all agesHow much forest do they fill?Each winter scientists measure how much Mexican forest the monarchs cover. Fill the forest yourself, one square at a time.
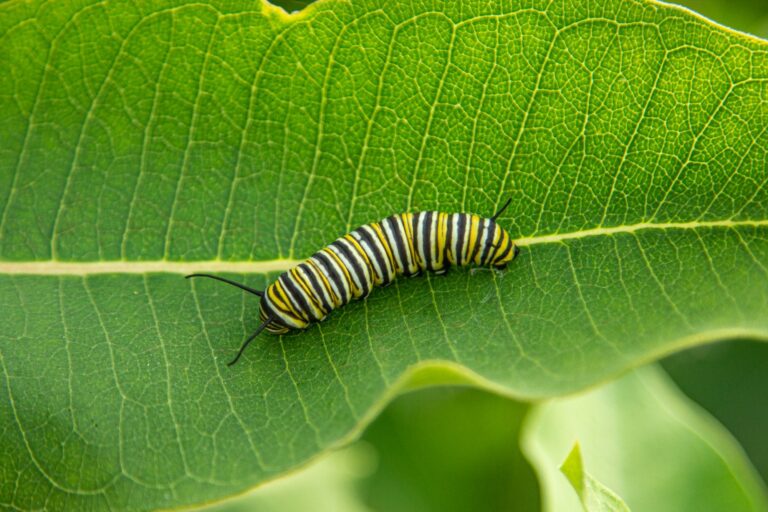
 Story 03 · MapWhere monarchs breed in CanadaEggs, caterpillars and chrysalises reported across the provinces. Southern Ontario is the nursery.